
In industrial power testing, motor drive debugging, inverter operation and maintenance and other application scenarios, the accurate collection
and analysis of three-phase waveform is the core link to determine the operating conditions of the equipment and troubleshoot potential failures.
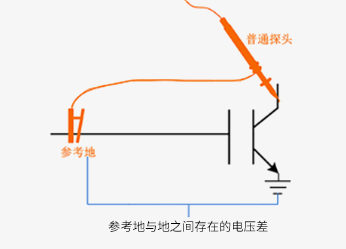
Conventional single-ended probes are limited by insufficient common-mode interference suppression,It is difficult to meet the accuracy
requirements in the three-phase system detection because of the defects such as the inability to directly measure the phase-to-line pressure difference.
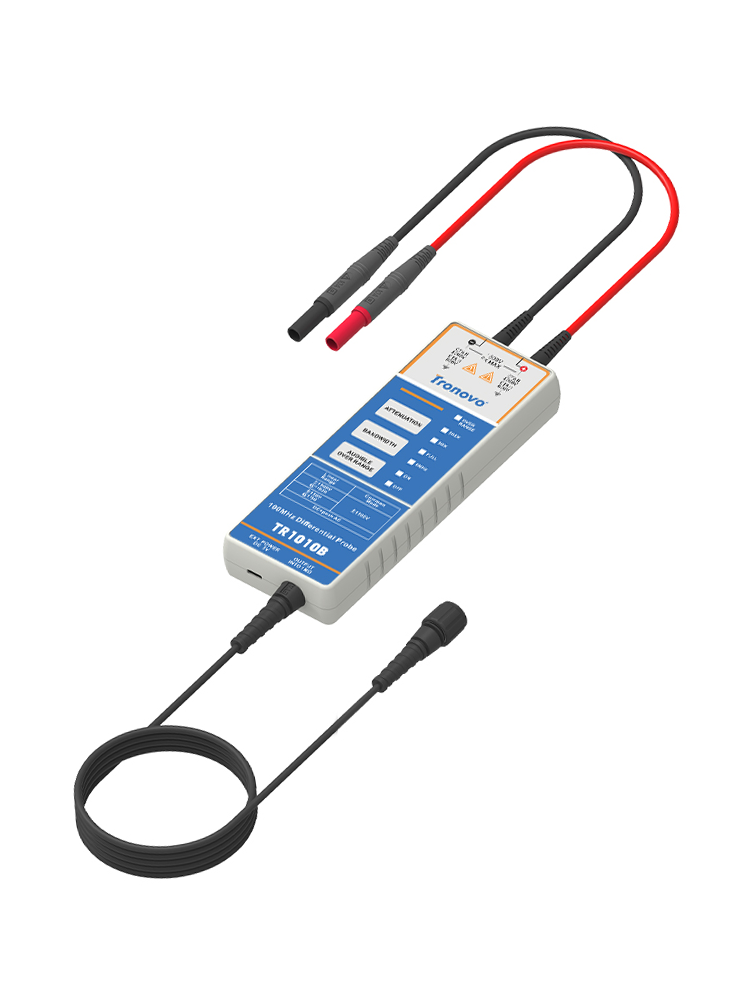
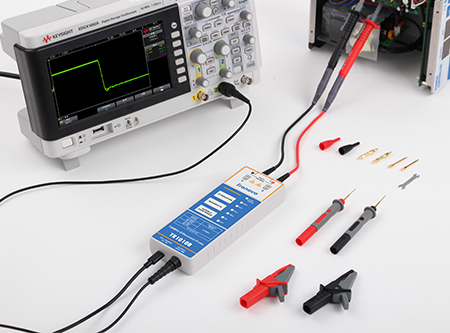
While the differential probe relies on High common mode rejection ratio (CMRR),Wide range voltageAdaptation and other core advantages,become
the preferred tool for three-phase waveform capture.
1. Core Concept Analysis: Building a Solid Foundation for Practical Operation
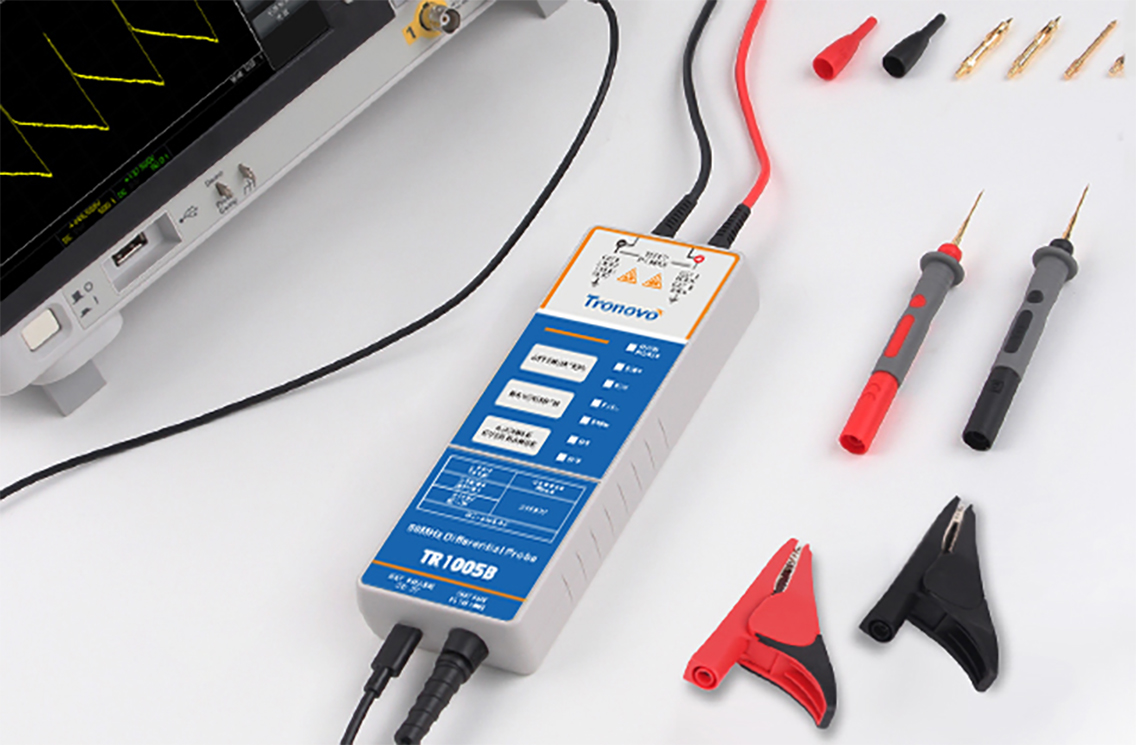
1.1 the core performance characteristics of the differential probe
Differential probe through the synchronous acquisition of two measurement points of the voltage signal, the difference operation to achieve accurate
measurement, its core advantages are:
●Common-mode interference suppression capability: it can efficiently filter out common-mode signals such as power line conducted interference and
space electromagnetic radiation (CMRR is usually not less than 60dB, and high-end models can reach 80dB and above),
Ensure the purity of the measurement waveform;
●Voltage difference direct measurement capability: without relying on a common reference ground, you can directly collect the line voltage
(such as L1-L2, L2-L3 voltage) or phase voltage (such as L1-N voltage) of the three-phase system;
●Wide range adaptation characteristics: with switchable attenuation ratio (e.g. 10:1, 100:1, 1000:1), the measurement range can cover 0-7kV or even
higher voltage levels, and can match low voltage 380V,Measurement requirements for different industrial scenarios such as high voltage 7kV.
Core observation parameters of 1.2 three-phase waveformsIn industrial three-phase power supply and drive systems, waveform analysis needs to
focus on three key characteristic parameters:
●Voltage amplitude relationship: the amplitude of line voltage (phase-to-line voltage) is √ 3 times of phase voltage (phase-to-zero voltage)
(for example, 380V line voltage corresponds to 220V phase voltage);
●Phase symmetry characteristics: under normal operation, the phase difference of the three-phase waveforms (L1, L2, L3) is strictly 120 °,
showing a symmetrical distribution trend;
●Waveform difference: the power frequency power supply system outputs a standard sine wave, and the inverter outputs a PWM pulse
modulation wave. A differential probe with matching bandwidth should be selected according to the waveform form.。
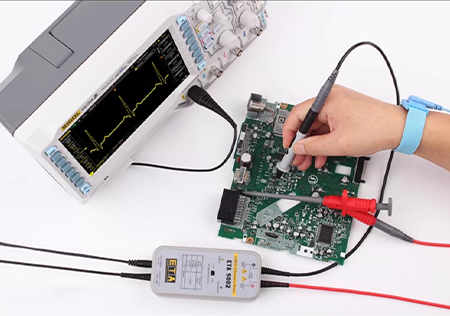
2. a step-by-step hands-on process: from wiring deployment to waveform capture
Wiring specification for 2.1 three-phase system (core operation link)
The corresponding wiring mode shall be selected according to the type of three-phase system (three-wire system/four-wire system), the power
supply of the system shall be cut off before wiring, and the correctness of wiring shall be checked with a multimeter before power-on test,
Eliminate the risk of short circuit:
(1) Three-phase four-wire system (including zero line N, such as power frequency mains power supply scenario)
Measurement object: phase voltage (L1-N, L2-N, voltage between L3-N)
Wiring steps:
1. Connect the positive input terminals () of the three differential probes to L1, L2 and L3 phase lines respectively;
The negative input terminals (-) of 2.3 probes are uniformly connected to the N terminal of the neutral line;
3. The ground wire (GND) of all probes is connected to the protective grounding terminal (PE) of the system, and suspension grounding is strictly
prohibited;
4. The 1, 2 and 3 channels of the oscilloscope correspond to 3 probes respectively, which are used to observe L1-N, L2-N and L3-N waveforms.
(2) Three-phase three-wire system (no zero line, such as motor drive, inverter output scene)
Measurement object: line voltage (L1-L2, L2-L3, voltage between L3-L1)
Wiring steps:
1. Probe 1 configuration: the positive input terminal () is connected to L1 phase line, and the negative input terminal (-) is connected to L2 phase
line for measuring L1-L2 line voltage;
2. Probe 2 configuration: the positive input terminal () is connected to the L2 phase line, and the negative input terminal (-) is connected to the L3
phase line for measuring the L2-L3 line voltage;
3. Probe 3 configuration: the positive input terminal () is connected to L3 phase line, and the negative input terminal (-) is connected to L1 phase
line for measuring L3-L1 line voltage;
4. Connect the ground wires of the three probes to the protective grounding end of the system to ensure that all ground wires are connected at the
same point.

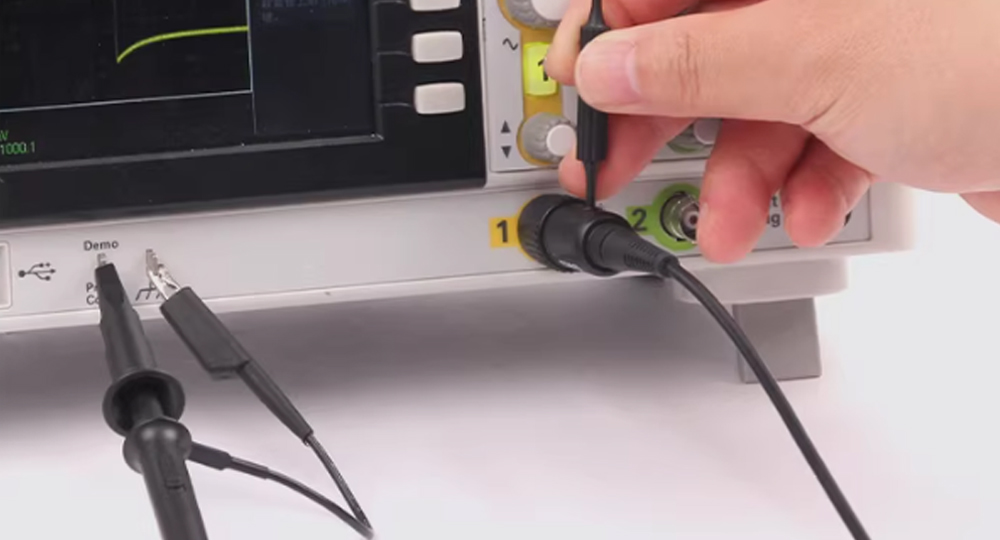
2.2 Oscilloscope Parameter Configuration (Accurately Capture Key Links)
(1) Channel parameter configuration
Enable the three measurement channels of the oscilloscope, and each channel needs to set parameters matching the attenuation ratio of the differential
probe; The voltage range is set according to the estimated measurement voltage (for example, when measuring 380V line voltage, 100:1 attenuation ratio
probe is selected,The attenuated signal amplitude is 3.8V, and the voltage level can be set to 5V/div).
(2) Trigger parameter configuration
Trigger source selection: select 1 of the three phases (e. g. L1) as trigger reference source to ensure synchronous acquisition of three-phase waveforms;
Trigger type adaptation: select "edge trigger" when measuring sine wave, and select "edge trigger" when measuring PWM modulation wave.
"Pulse trigger"; trigger level adjustment: set to about 1/3 of the signal amplitude
(For example, when measuring 380V line voltage, the trigger level is set to about 120V) to avoid false triggering due to interference.
(3) Time base and sampling rate configuration
Power frequency 50Hz waveform measurement scenario: the time base gear is set to 20ms/div (the single cycle of power frequency waveform is 20ms,
and this gear can display 2-3 complete cycles in the 1 screen); Inverter PWM Wave Measurement Scene (Switching frequency 10kHz for example):
The time base gear is set to 100 μs/div and the sampling rate is set to 10MSa/s to ensure accurate capture of pulse details.
2.3 Waveform Capture and Optimization Adjustment
1. After the system is powered on, start the "single capture" or "continuous capture" function of the oscilloscope to observe the waveform stability;
2. If the waveform drifts, fine-tune the trigger level parameters or increase the trigger hold-off time appropriately (for example, the power frequency
scenario is set to 10ms);
3. Phase calibration adjustment: take the trigger phase (such as L1) as the reference and ensure that the phase difference between L2 and L3
waveforms and L1 is accurately maintained at 120 and 240 respectively through the oscilloscope phase delay adjustment function;
4. Key area amplification: local amplification of key points such as waveform peak value and zero crossing point (for example, adjusting the voltage
gear to 1V/div) is convenient for subsequent accurate measurement of parameters.
Key Points of 3. Waveform Analysis: Determining System Running Status
3.1 key parameter measurement and standard comparison
Use the "measurement function" of the oscilloscope to extract the following key parameters and compare them with the standard values:
●Amplitude accuracy verification: the peak value of line voltage shall conform to 1.414 times of the nominal value (I. e. √ 2 times), for example, the
peak value of 380V line voltage is about 537V, and the peak value of 220V phase voltage is about 311V;
●Phase difference detection: the phase difference between the L1-L2 and the L2-L3 should be controlled within the range of 120 ° ± 5 °, beyond
which there may be load imbalance or line fault;
●Frequency and distortion characteristics: The frequency of the power frequency power supply waveform shall be stable within the range of 50Hz
± 0.5Hz. The total harmonic distortion (THD) shall be detected through the FFT analysis function of the oscilloscope. The THD shall be ≤ 5% under
normal working conditions.
4. Abnormal Diagnosis

Building 9, No. 269, Xinfeng Road, Xukou Town, Wuzhong District, Suzhou, China
0512-66559708

WeChat customer

Tmall Official Flagship Store
Copyright © 2003-2026 , All Rights Reserved AiYong Instruments (Suzhou) Co., Ltd.